Prices of german houses

So for a while I had a scraper running, which, once a day, scraped housing prices from chosen regions in Germany. I accumulated about 6 month of data until I stopped it, mainly because I didn’t feel like I’d ever properly utilise it.

I decided to at least show some of it. This post is basically excerpts from a Jupyter notebook. A link to the data can be found at the end.

Small side-note: The diagrams in this post are best viewed in day mode. Sorry, fellow night-moders🌑

Reading raw data

The data was split into one newline delimited JSON per day. So first, read it into a DataFrame.

 1
 2
 3
 4
 5
 6
 7
 8
 9
10
11
12
13
14
15
16
17
18
19
import os
import json
from typing import List, Dict

def read_data(path: str) -> List[Dict]:
    """ Reads all JSONs from the data folder. """
    data = []
    for filename in os.listdir(path):
        if filename.endswith(".json") or filename.endswith(".jl"):
            with open(os.path.join(path, filename)) as f:
                for jl in f:
                    data.append(json.loads(jl))

    return data


import pandas as pd

raw_data = pd.DataFrame(read_data("."))

Cleansing data

The next step was to clean the data a bit, since it was quite messy (scraped directly out of HTML). Let’s focus on the important bits:

  • One of the dimensions to group by will be time. So we format the crawl_time into datetime.
  • area_total somtimes contains prices. Talk about messy, so we filter that
  • price_num contains decimal signs, € signs and also ranges. We replace as much as we can, but ranges will be dropped altogether.
  • room_number usually contains the rooms twice, so we regexp the first number.
1
2
3
4
5
6
raw_data["date"] = pd.to_datetime(raw_data["crawl_time"], format="%Y-%m-%dT%H:%M:%SZ")
raw_dataraw_ = raw_data[~raw_data["area_total"].str.contains("€")]
raw_data["price_num"] = pd.to_numeric(raw_data["price"].str.replace("€", "").str.replace(".", "").str.replace(",", ""), errors="coerce")
raw_data["total_area"] = pd.to_numeric(raw_data["area_total"].str.replace("m2", "").str.replace("²", "").str.replace("m", "").str.replace(",", ""), errors="coerce")
raw_data["area"] = pd.to_numeric(raw_data["area_living"].str.replace("m2", "").str.replace("²", "").str.replace("m", "").str.replace(",", ""), errors="coerce")
raw_data["rooms"] = pd.to_numeric(raw_data["room_number"].str.extract(r"(^\d+[\s])", expand=True)[0])

Then I moved everything I needed into a clean dataframe. From there, I also removed one weird outlier (some castle costing 1.5B€🏰).

1
2
3
4
5
d = raw_data[["date", "search_region", "expose_id", "price_num", "area", "total_area", "rooms"]]
# Remove weird outlier
outlier = raw_data["price_num"].idxmax(axis="columns")
d.iloc[[outlier]]
d = d[d["price_num"] < 1000000000]

Now let’s get an overview of the general shape of the data.

1
2
print(raw_data.search_region.unique())
print(len(raw_data))

results in

 1
 2
 3
 4
 5
 6
 7
 8
 9
10
11
12
13
14
15
16
17
18
19
20
21
22
23
['baden-wuerttemberg/stuttgart' 'baden-wuerttemberg/mannheim'
 'baden-wuerttemberg/freiburg-im-breisgau' 'baden-wuerttemberg/karlsruhe'
 'baden-wuerttemberg/ortenaukreis' 'baden-wuerttemberg/heidelberg'
 'bayern/muenchen-kreis' 'bayern/wuerzburg-kreis' 'bayern/nuernberg'
 'bayern/nuernberger-land-kreis' 'hessen/frankfurt-am-main'
 'hessen/offenbach-am-main' 'hessen/wiesbaden' 'rheinland-pfalz/mainz'
 'nordrhein-westfalen/aachen-kreis' 'nordrhein-westfalen/bonn'
 'nordrhein-westfalen/koeln' 'nordrhein-westfalen/duesseldorf'
 'nordrhein-westfalen/essen' 'nordrhein-westfalen/dortmund'
 'nordrhein-westfalen/muenster' 'nordrhein-westfalen/bielefeld'
 'bremen/haus-kaufen?pagenumber=1' 'hamburg/hamburg'
 'niedersachsen/hannover-kreis' 'berlin/berlin' 'sachsen/leipzig-kreis'
 'sachsen/dresden' 'bremen/haus-kaufen?pagenumber=19'
 'bremen/haus-kaufen?pagenumber=18' 'bremen/haus-kaufen?pagenumber=17'
 'bremen/haus-kaufen?pagenumber=16' 'bremen/haus-kaufen?pagenumber=15'
 'bremen/haus-kaufen?pagenumber=14' 'bremen/haus-kaufen?pagenumber=13'
 'bremen/haus-kaufen?pagenumber=12' 'bremen/haus-kaufen?pagenumber=11'
 'bremen/haus-kaufen?pagenumber=10' 'bremen/haus-kaufen?pagenumber=9'
 'bremen/haus-kaufen?pagenumber=8' 'bremen/haus-kaufen?pagenumber=7'
 'bremen/haus-kaufen?pagenumber=6' 'bremen/haus-kaufen?pagenumber=5'
 'bremen/haus-kaufen?pagenumber=4' 'bremen/haus-kaufen?pagenumber=3'
 'bremen/haus-kaufen?pagenumber=2' 'bremen/wohnung-kaufen?pagenumber=1']
298098

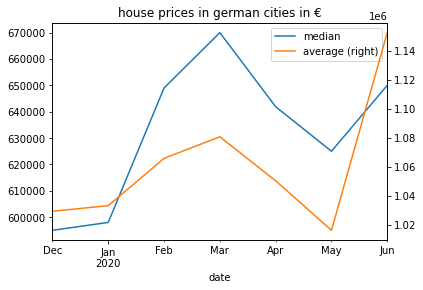
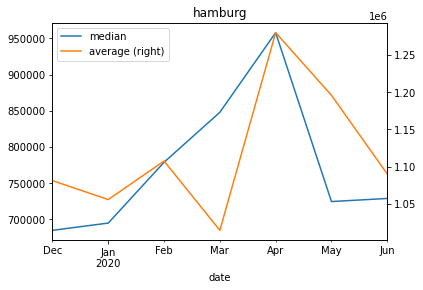
Let’s get an overview of the totals. Let’s plot the overall average and median.

1
2
3
4
5
6
7
agg_per_month = d[["date", "search_region", "price_num"]].copy()
agg_per_month = agg_per_month[["date", "price_num"]][agg_per_month["price_num"].notna()]
avg_per_month = agg_per_month.rename(columns={"price_num": "average"}).resample('M', on="date", kind="timestamp").mean()
med_per_month = agg_per_month.rename(columns={"price_num": "median"}).resample('M', on="date", kind="timestamp").median()

ax = med_per_month.plot()
avg_per_month.plot(ax=ax, secondary_y=True, title="house prices in german cities in €")
Average and median overall

One can definitly see the dent that the corona crisis created. 
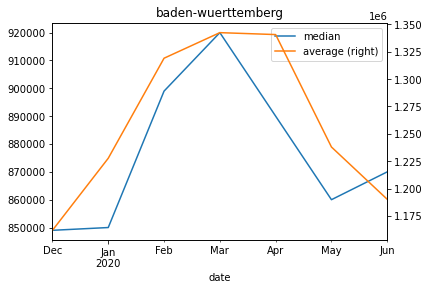
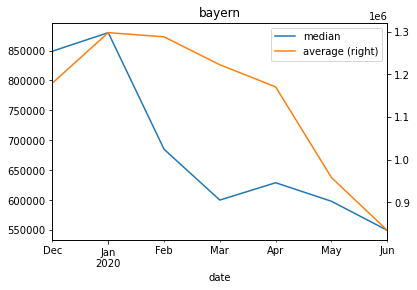
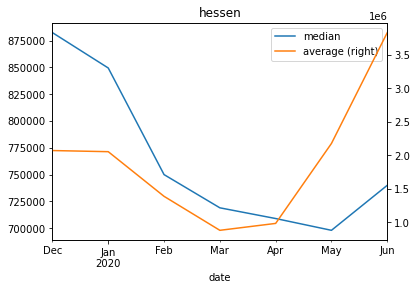
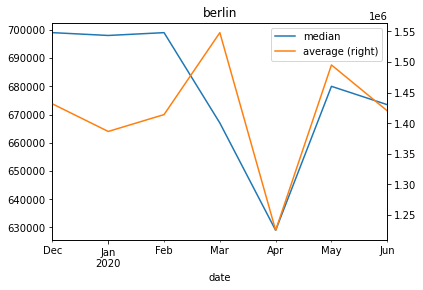
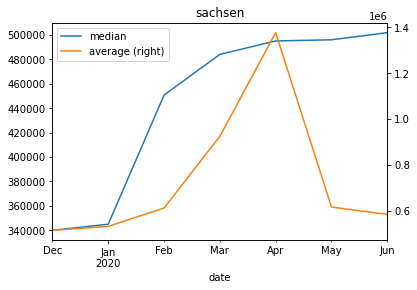
Let’s dive a bit into the various cities and regions.

1
2
3
4
5
6
7
8
9
bundeslaender = ["baden-wuerttemberg", "bayern", "hessen", "nordrhein-westfalen", "hamburg", "niedersachsen", "berlin", "sachsen"]
df = d[["date", "search_region", "price_num"]].copy()[agg_per_month["price_num"].notna()]

for b in bundeslaender:
    med = df[df["search_region"].str.startswith(b)][["date", "price_num"]].rename(columns={"price_num": "median"}).resample('M', on="date", kind="timestamp").median()
    avg = df[df["search_region"].str.startswith(b)][["date", "price_num"]].rename(columns={"price_num": "average"}).resample('M', on="date", kind="timestamp").mean()
    
    ax = med.plot()
    avg.plot(ax=ax, secondary_y=True, title=b)

This produces various graphs for the Bundesländer.

Average and median Baden-Württemberg

Average and median Bayern

Average and median Hessen

Average and median NRW

Average and median Hamburg

Average and median Niedersachsen

Average and median Berlin

Average and median Sachsen

Data

Since I’m a data engineer, and much more about collection and providing data, than about analysing, I will do exactly what I do best and provide the data. I packed it all into one JSON, instead of many, and compressed it with 7z.

DE_house_prices_201912-202006.7z

If you do anything nice with it, feel free to contact me via twitter🧑‍💻.

Lessons learned

What did I learn? First of all, I’m not much of a data scientist. While I do have ideas of what else I could with the data, it does not really motivate me to keep on going.

For example, one could split out prices by area, rooms, city center or suburbs, …

Working with pandas also does not feel entirely intuiative to me, mostly because most of data wrangling I usually do between low-level languages and python. And whenever I really do want to display some results, I fall back to tables and excel. Which admittedly works fine for pretty much all my use-cases. And although it’s nice to try out new things, sticking to what you love to do usually yields in more fun. Especially for side projects!😃

So, look forward to that. Still, this might not be my last dip into dataframes, notebooks and plotting.